Sign up for the monthly RVAgreen 2050 newsletter here.
Call us at (804) 646-6957
Email us at rvagreen@rva.gov
![]()
![]()
![]()
![]()
The City’s first sustainability plan, RVAgreen: A Roadmap to Sustainability, was developed in 2011 and adopted by Richmond City Council in 2012. It was designed to improve the quality of life for residents, create a healthy environment and enhance economic opportunity in the City of Richmond. It had 55 initiatives within five focus areas: economic development, energy, environment, open space and land use and transportation.
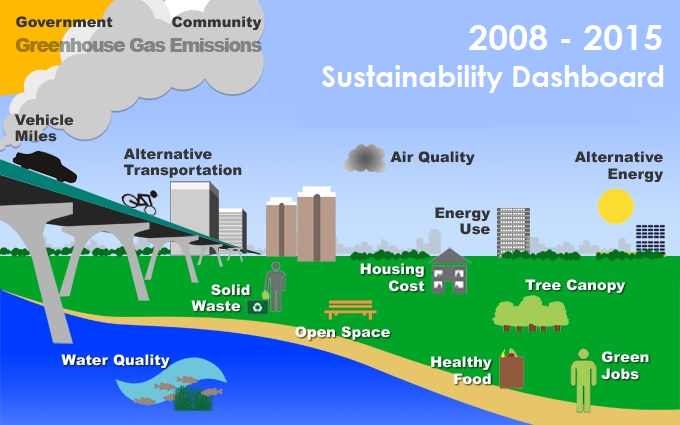
Check out the RVAgreen Sustainability Indicators below to see the progress made on these initiatives between 2008 and 2015.
 Sustainability Indicator: Green Jobs
 Target: Increase Clean Sector Jobs as a Percentage of Total Jobs
Clean sector jobs are identified in the Bureau of Labor Statistics' Standard Occupational Classification code system as either "Green Enhanced Skills, Green Increased Demand, or Green New & Emerging." Some sectors of our local economy where green jobs exist include renewable energy, energy efficiency, green construction, conservation, and recycling.

 Sustainability Indicator: Access to Healthy Food
 Target: Increase in Number of Residents Living Within One Mile of a Grocery Store, One-Quarter Mile of Other Healthy Food Options
Local, healthy and sustainable food should be accessible and affordable. Healthy food options are places where local, healthy and sustainable food is available.

 Sustainability Indicator: Alternative Energy
 Target: Increase Renewable Energy Capacity Within the Community
The Department of Mines, Minerals and Energy (DMME) tracks solar and wind installations and provides data on the capacity of these installations as watts net metered.

 Sustainability Indicator: Energy Use
 Target: Decrease Energy Consumption Within the Community
Dominion Virginia Power tracks and provides kWh energy consumed by sector: residential, commercial, industrial and governmental which includes federal, state and local government facilities within the city of Richmond.

 Sustainability Indicator: Solid Waste
 Target: Increase In Community Recycling Rate
The recycling rate measures the amount of recycling as a percentage of total solid waste (recycling + landfill).

 Sustainability Indicator: Water Quality
 Target: Increase in Number of Acres Treated by Best Management Practices (BMP)
The Best Management Practices (BMP) measured by this indicator are water pollution controls that are physical installations such as retention ponds, rain gardens, and other infrastructure designed to reduce stormwater runoff into the James River and Chesapeake Bay.

 Sustainability Indicator: Air Quality
 Target: Decrease in the Number of Unhealthy Air Quality Days
Air quality is measured on an Index referred to as the AQI that runs from 0 to 500.The higher the AQI value, the greater the level of air pollution and health concern on a given day.


 Sustainability Indicator: Access to Open Space
 Target: Increase in Number of Residents Living Within one-quarter Mile of a City Park or Open Space
City-owned parks and open spaces provide places for people to exercise, play, relax and connect with nature.

 Sustainability Indicator: Urban Tree Canopy
 Target: Increase In Number of Trees Planted on Public Property
This indicator only measures trees planted on public property because the city can track and measure this on an annual basis. Trees planted on private property in the city are just as important to the urban tree canopy.
An urban tree canopy survey that measures the entire tree canopy throughout the city is conducted every few years.

 Sustainability Indicator: Housing Cost Burden
 Target: Decrease in Percentage of Households Paying More Than 30% of Their Income for Housing
According to the U.S. Department of Housing & Urban Development, housing is considered unaffordable if its costs more than 30% of a household or family's income.


 Sustainability Indicator: Alternate Transportation
 Target: Increase in Percent of Trips by Mode Share Other Than Single Occupant Vehicle
When people choose a means of travel other than driving alone in a car, they are choosing an alternate mode that is often more convenient, healthier, more cost-effective and better for the environment.


 Sustainability Indicator: Vehicle Miles Traveled
 Target: Decrease Per Capita of Daily Vehicle Miles Traveled (VMT)
Daily Vehicle Miles Traveled (VMT) is an estimate by the Virginia Department of Transportation based on traffic counts and lane miles. It is an indicator of all motorized vehicle travel levels in the city.

 Sustainability Indicator: Climate Action
 Community Greenhouse Gas (GHG) Emissions
Target: Decrease Community GHG Emissions By 80% by 2050
The Climate Action section sets a goal to reduce the community's greenhouse gas emissions by 80% by 2050 using 2008 emissions as the baseline. This goal is essential for a vibrant and resilient Richmond.

 Municipal Greenhouse Gas (GHG) Emissions
Target: Decrease Municipal GHG Emissions By 80% by 2050
The Climate Action section sets a goal to reduce city government's greenhouse gas emissions by 80% by 2050 using 2008 emissions as the baseline. This goal is essential for a vibrant and resilient Richmond.